- About the author
- Questions and Issues
- Edit and Contribute
- Introduction
- 1. Basics
- 2. Elements
- 3. Network
-
4. Sources
- 4.1. Pretty Print
- 4.2. Editing Content
- 4.3. Local Modifications
- 4.4. Workspaces
- 4.5. Debugging
- 4.6. Restart Frame
- 4.7. Long Resume
- 4.8. Skipping Frameworks
- 4.9. Conditional Breakpoints
- 4.10. Uncaught Exceptions
- 4.11. Asyncronous Stacktraces
- 4.12. Store as Global
- 4.13. WebWorkers
- 4.14. SourceMaps
- 4.15. Snippets
- 5. Timeline
- 6. Profiles
- 7. Audits
- 8. Console
- 9. Mobile
- 10. Extensions
- 11. Custom Skins
- Generated using GitBook
Console
In addition to providing a convenient workspace for testing code, the console also provides a chrome specific API for inspecting and debugging applications. It is important to remember that the console is available from all other tabs by pressing the Esc key.
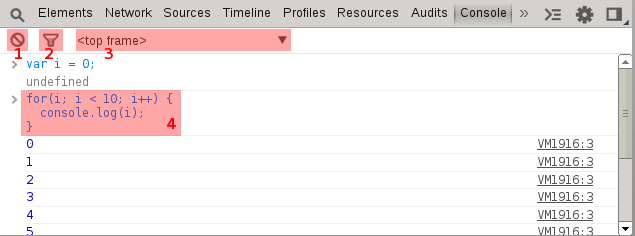
- Clear the console output
- Filter the console to display specific output
- Change the console input to be executed with the context of a specific frame (frame, iframe, or extension).
- Enter multi-line code with
shift+enter - The shortcut
ctrl+Lclears the console
Exercise
Load the console and notice at the top frame the global variable iFrameApp is not defined. Switch the frame to iframe.html and it is defined.