- About the author
- Questions and Issues
- Edit and Contribute
- Introduction
- 1. Basics
- 2. Elements
- 3. Network
-
4. Sources
- 4.1. Pretty Print
- 4.2. Editing Content
- 4.3. Local Modifications
- 4.4. Workspaces
- 4.5. Debugging
- 4.6. Restart Frame
- 4.7. Long Resume
- 4.8. Skipping Frameworks
- 4.9. Conditional Breakpoints
- 4.10. Uncaught Exceptions
- 4.11. Asyncronous Stacktraces
- 4.12. Store as Global
- 4.13. WebWorkers
- 4.14. SourceMaps
- 4.15. Snippets
- 5. Timeline
- 6. Profiles
- 7. Audits
- 8. Console
- 9. Mobile
- 10. Extensions
- 11. Custom Skins
- Generated using GitBook
Debugging
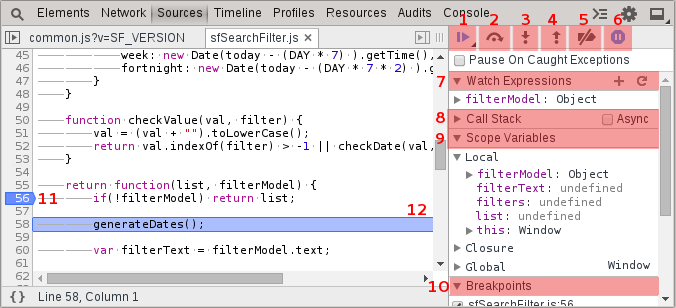
- Resume script execution -
F8 - Step over to the nex function call -
F10 - Step into the next function call -
F11 - Step out of the current function scope -
shift+F11 - Deactivate all breakpoints.
- Pause on exceptions - very useful for inspecting the context of application errors.
- Watch Expressions - expressions that will be continuously evaluated as you step through the application.
- Call stack - View and navigate to frames in the call stack. Can evaluate expressions and inspect the context of other frames.
- Scope Variables - inspect variables within the current context.
- Breakpoints - a list of all current breakpoints in the application. Enable/disable them through the checkbox.
- Click a line to add or remove a breakpoint.
- The currently executing line.
Note: If you want to asyncronously proceed to a specific line of code, right click that line and select Continue to Here.